• How Stethoscope Works....

    A stethoscope is a medical device for listening to sounds inside the body. The initial stethoscope was invented in the early 19th century by French physician Ren� Laennec, but was actually trying to achieve a rather different end: doctor-patient distance....

  • Care Plan For Decreased Cardiac Output...

    Nursing diagnosis for decreased cardiac output may be related to altered myocardial contractility, inotropic changes; alterations in rate, rhythm, electrical conduction; or structural changes, such as valvular defects and ventricular aneurysm. ...

  • ECG Waveforms And Components

    The electrocardiogram (ECG) is a graphic recording ofelectric potentials generated by the heart.The signals are detected by means of metal electrodes attached to the extremities and chest wall and are then amplified and recorded by the electrocardiograph. ECG leads actually display the instantaneous differences in potential between these electrodes. ...

Showing posts with label ECG. Show all posts

Thursday, June 8, 2017

ELECTROPHYSIOLOGY

Depolarization of the heart is the initiating event for cardiac contraction. The electric currents that spread through the heart are produced by three components: cardiac pacemaker cells, specialized conduction tissue, and the heart muscle itself.The ECG,however, records only the depolarization (stimulation) and repolarization (recovery) potentials generated by the atrial and ventricular myocardium.
The depolarization stimulus for the normal heartbeat originates in the sinoatrial (SA) node, or sinus node, a collection of pacemaker cells.These cells fire spontaneously; that is, they exhibit automaticity. The first phase of cardiac electrical activation is the spread of the depolarization wave through the right and left atria, followed by atrial contraction. Next, the impulse stimulates pacemaker and specialized conduction tissues in the atrioventricular (AV) nodal and His-bundle areas; together, these two regions constitute the AV junction. The bundle of His bifurcates into two main branches, the right and left bundles, which rapidly transmit depolarization wavefronts to the right and left ventricular myocardium by way of Purkinje fibers. The main left bundle bifurcates into two primary subdivisions, a left anterior fascicle and a left posterior fascicle. The depolarization wavefronts then spread through the ventricular wall, from endocardium to epicardium, triggering ventricular contraction.
Since the cardiac depolarization and repolarization waves have direction and magnitude, they can be represented by vectors. Vectorcardiograms that measure and display these instantaneous potentials are no longer used much in clinical practice.However, the general principles of vector analysis remain fundamental to understanding the genesis of normal and pathologic ECG waveforms.Vector analysis illustrates a central concept of electrocardiography—that the ECG records the complex spatial and temporal summation of electrical potentials from multiple myocardial fibers conducted to the surface of the body.This principle accounts for inherent limitations in both ECG sensitivity (activity from certain cardiac regions may be canceled out or may be too weak to be recorded) and specificity (the same vectorial sum can result from either a selective gain or a loss of forces in opposite directions).
Read More

Monday, November 25, 2013

Using Electrocardiography (ECG) to Measures the Heart's Electrical Activity

Prepare the machine by placing the ECG machine close to the patient's bed, and plug the power cord into the wall outlet. To accommodate the precordial leads and minimize electrical interference on the ECG tracing, remove the electrodes if the patient is already connected to a cardiac monitor. Keep the patient away from objects that might cause electrical interference, such as equipment, fixtures, and power cords.

Explain the procedure to the patient as you set up the machine to record a 12-lead ECG. Tell him that the test records the heart's electrical activity and it may be repeated at certain intervals. Also, tell him that the test typically takes about 5 minutes. Emphasize that no electrical current will enter his body.

Have the patient lie in a supine position in the center of the bed with his arms at his sides. You may raise the head of the bed to promote his comfort. Expose his arms and legs, and drape him appropriately. His arms and legs should be relaxed to minimize muscle trembling, which can cause electrical interference.
Place the patient's hands under his buttocks to prevent muscle tension if the bed is too narrow. Also use this technique if the patient is shivering or trembling. Make sure his feet aren't touching the bed board.
Select flat, fleshy areas to place the electrodes. Avoid muscular and bony areas. If the patient has an amputated limb, choose a site on the stump. If an area is excessively hairy, clip it. Clean excess oil or other substances from the skin to enhance electrode contact.
Apply the electrode paste or gel or the disposable electrodes to the patient's wrists and to the medial aspects of his ankles. If you're using paste or gel, rub it into the skin. If you're using disposable electrodes, peel off the contact paper and apply them directly to the prepared site, as recommended by the manufacturer's instructions. To guarantee the best connection to the leadwire, position disposable electrodes on the legs with the lead connection pointing superiorly.
If you're using paste or gel, secure electrodes promptly after you apply the conductive medium. This prevents drying of the medium, which could impair ECG quality. Never use alcohol or acetone pads in place of the electrode paste or gel because they impair electrode contact with the skin and diminish the transmission quality of electrical impulses.
Connect the limb leadwires to the electrodes. Make sure the metal parts of the electrodes are clean and bright. Dirty or corroded electrodes prevent a good electrical connection.
You'll see that the tip of each leadwire is lettered and color-coded for easy identification. The white or RA leadwire goes to the right arm; the green or RL leadwire, to the right leg; the red or LL leadwire, to the left leg; the black or LA leadwire, to the left arm; and the brown or V1 to V6 leadwires, to the chest.
Now, expose the patient's chest. Put a small amount of electrode gel or paste on a disposable electrode at each electrode position.
If your patient is a woman, be sure to place the chest electrodes below the breast tissue. In a large-breasted woman, you may need to displace the breast tissue laterally.
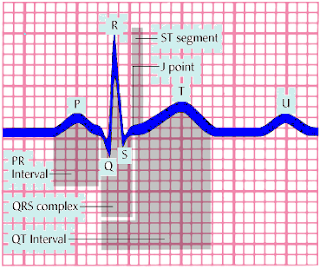
Check to see that the paper speed selector is set to the standard 25 mm/second and that the machine is set to full voltage. The machine will record a normal standardization mark—a square that's the height of two large squares or 10 small squares on the recording paper. Then, if necessary, enter the appropriate patient identification data.
If any part of the waveform extends beyond the paper when you record the ECG, adjust the normal standardization to half-standardization. Note this adjustment on the ECG strip because this will need to be considered in interpreting the results.
Now you're ready to begin the recording. Ask the patient to relax and breathe normally. Tell him to lie still and not to talk when you record his ECG. Then press the AUTO button. Observe the tracing quality. The machine will record all 12 leads automatically, recording three consecutive leads simultaneously. Some machines have a display screen so you can preview waveforms before the machine records them on paper.
When the machine finishes recording the 12-lead ECG, remove the electrodes and clean the patient's skin. After disconnecting the leadwires from the electrodes, dispose of or clean the electrodes, as indicated.
 
 
Read More

Friday, October 11, 2013

ECG Waveforms And Components

The electrocardiogram (ECG) is a graphic recording ofelectric potentials generated by the heart.The signals are detected by means of metal electrodes attached to the extremities and chest wall and are then amplified and recorded by the electrocardiograph. ECG leads actually display the instantaneous differences in potential between these electrodes.
The clinical utility of the ECG derives from its immediate availability as a noninvasive, inexpensive, and highly versatile test. In addition to its use in detecting arrhythmias, conduction disturbances, and myocardial ischemia, electrocardiography may reveal other findings related to life-threatening metabolic disturbances (e.g., hyperkalemia) or increased susceptibility to sudden cardiac death (e.g., QT prolongation syndromes). The widespread use of coronary fibrinolysis and acute percutaneous coronary interventions in the early therapy of acute myocardial infarction has refocused attention on the sensitivity and specificity of ECG signs of myocardial ischemia.
An electrocardiogram (ECG) waveform has three basic components: the P wave, QRS complex, and T wave. These elements can be further divided into the PR interval, J point, ST segment, U wave, and QT interval.
P wave and PR interval
The P wave represents atrial depolarization. The PR interval represents the time it takes an impulse to travel from the atria through the atrioventricular nodes and bundle of His. The PR interval measures from the beginning of the P wave to the beginning of the QRS complex.
QRS complex
The QRS complex represents ventricular depolarization (the time it takes for the impulse to travel through the bundle branches to the Purkinje fibers).
The Q wave appears as the first negative deflection in the QRS complex; the R wave, as the first positive deflection. The S wave appears as the second negative deflection or the first negative deflection after the R wave.
J point and ST segment
Marking the end of the QRS complex, the J point also indicates the beginning of the ST segment. The ST segment represents part of ventricular repolarization.
T wave and U wave
Usually following the same deflection pattern as the P wave, the T wave represents ventricular repolarization. The U wave follows the T wave, but isn't always seen.
QT interval
The QT interval represents ventricular depolarization and repolarization. It extends from the beginning of the QRS complex to the end of the T wave.
Read More
Powered by Blogger.

Search This Blog